
The question Wyckoff analysis asks
Wyckoff analysis studies how price behaves inside and around a trading range, using price spread, volume and time to assess the changing balance between supply and demand. A trading range (TR) is an area where price moves between developing support and resistance after a prior advance or decline; it is not automatically accumulation or distribution. Accumulation is a hypothesis that demand is absorbing available supply before a possible advance. Distribution is the opposite hypothesis: supply is meeting demand before a possible decline. The labels describe an interpretation of observable market action. They do not prove who placed orders or what a large participant intends. Wyckoff Analytics also uses “Composite Man” as a teaching model for considering the market as if a single informed operator were acting; it cannot be identified as a literal person from a chart.
The three laws and what to observe
Supply and demand: compare the direction and progress of price bars with volume. A wide upward spread that closes near its high on increased volume can suggest demand; a wide decline that closes near its low on increased volume can suggest supply. These are clues to weigh in context, not standalone signals. Cause and effect: a trading range is treated as the “cause” and a later move as the possible “effect.” Wyckoff’s method uses horizontal Point-and-Figure (P&F) counts to estimate a potential objective; the count is an estimate, not a forecast. Effort versus result: compare volume (effort) with price progress (result). High activity with little progress can indicate opposition or absorption, but its meaning depends on where it occurs and what follows. The three laws organize analysis; they do not establish a guaranteed causal mechanism.
Accumulation: phases A and B
Phase A is the attempted stopping of the preceding downtrend. Preliminary Support (PS) may be the first notable buying response. Selling Climax (SC) describes a sharp episode of supply and selling, often followed by an Automatic Rally (AR) as selling pressure eases and buying or short covering lifts price. A Secondary Test (ST) revisits the SC area; compare its spread and volume with the earlier decline rather than requiring an exact low. The SC low, AR high and later tests help define the developing TR. Phase B is the longer examination of supply and demand inside that range. Repeated rallies and reactions, their relative spread and volume, and whether price makes progress help build or weaken the accumulation hypothesis. Phase A events can be less dramatic or absent in re-accumulation, so one template cannot be imposed on every range.
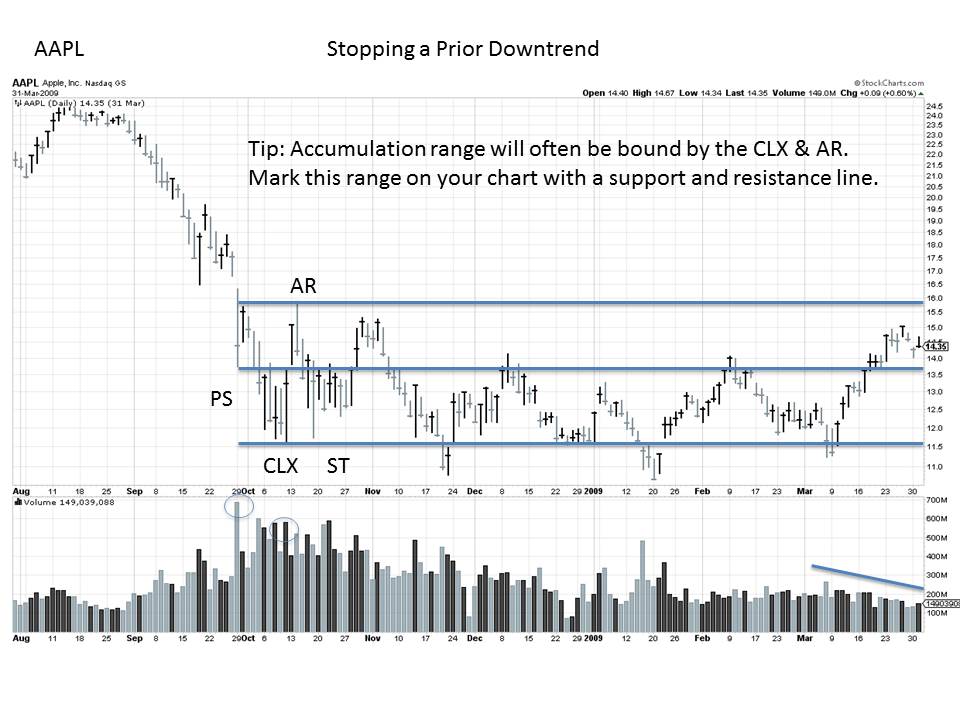
Accumulation: phases C, D and E
On the chart, first mark the range high and low from bars that have already closed. An early, higher-risk long idea is a break below the range low that quickly closes back inside, followed by a test that holds; Wyckoff calls the break-and-return a Spring. The possible entry is after that recovery or the test turns up, with invalidation below the test low. If price instead closes below the range and cannot reclaim it, the idea is wrong. A later entry waits for a clear close above the range, then a pullback that holds the old ceiling and turns up; this is later and may never appear. Wyckoff calls the upward escape SOS/JAC, the pullback BU, and a support-holding reaction LPS. Phase E simply describes price continuing outside the range. These names do not make either entry reliable. Without usable volume, this is only a price-based hypothesis, not full Wyckoff confirmation.
Distribution: its own phases and events
Distribution is analyzed as a separate trading-range hypothesis following an advance. In Phase A, Preliminary Supply (PSY) and a Buying Climax (BC) may show the first meaningful interruption of demand. An Automatic Reaction (AR) and Secondary Test (ST) help define the range. In Phase B, observe whether rallies continue to make upward progress or meet increasing supply. In Phase C, an Upthrust (UT) or Upthrust After Distribution (UTAD) can briefly move above resistance and return to the range; it is a possible test of demand, not proof of manipulation. Phase D may show Signs of Weakness (SOW) and weak rallies called Last Points of Supply (LPSY). Phase E is the possible markdown after price leaves the range with supply dominant. Wyckoff schematics include variations: a UTAD is not required, and the sequence can be less textbook-like. Do not call every resistance break a UTAD or every decline a SOW without checking the definition and context.
Events are evidence, not labels to collect
The event names are useful only when tied to observable conditions. For each candidate event, record the location relative to TR support or resistance, the price spread, close, volume relative to nearby bars, and what the next reaction or test does. For example, a move below support that stays below it is not yet the described Spring-and-return pattern. An SOS label needs evidence of meaningful upward progress in the range context; one green bar alone is insufficient. Similarly, volume is feed-specific: centralized exchange volume, futures volume and retail FX tick volume are not interchangeable measurements. If the data source does not provide comparable volume, state that limitation and avoid conclusions that depend on it. Keep alternative readings open while a range is still forming.
Cause and effect: the Point-and-Figure count
P&F charts reduce price movement to columns of Xs and Os after a chosen box size and reversal amount are applied. In Wyckoff analysis, a horizontal count across a trading range is used to estimate how much cause may have developed; the count is then translated into a potential price objective according to the method’s counting rules. Results depend on chart construction, the count line, the boundaries selected and which part of the range qualifies. Different defensible choices can produce different objectives. Treat a count as a conditional measuring technique, document the settings and range used, and compare the objective with actual subsequent movement. Do not use the projected distance as a promised target or as proof that accumulation or distribution occurred.
A repeatable way to study a range
First mark the trend that preceded the range and the data source, instrument and timeframe. Draw provisional support and resistance from repeated reactions, not from a preferred schematic. Then annotate candidate events with the evidence: spread, close, volume and time spent in the area. Write the accumulation and distribution readings separately, including what future behaviour would support or weaken each one. If using a P&F objective, record box size, reversal amount and count boundaries. Replay forward one bar at a time so later price action does not leak into earlier decisions. Keep examples where the expected transition never happens. This procedure makes the interpretation reviewable; it does not turn Wyckoff labels into a mechanical trading system.