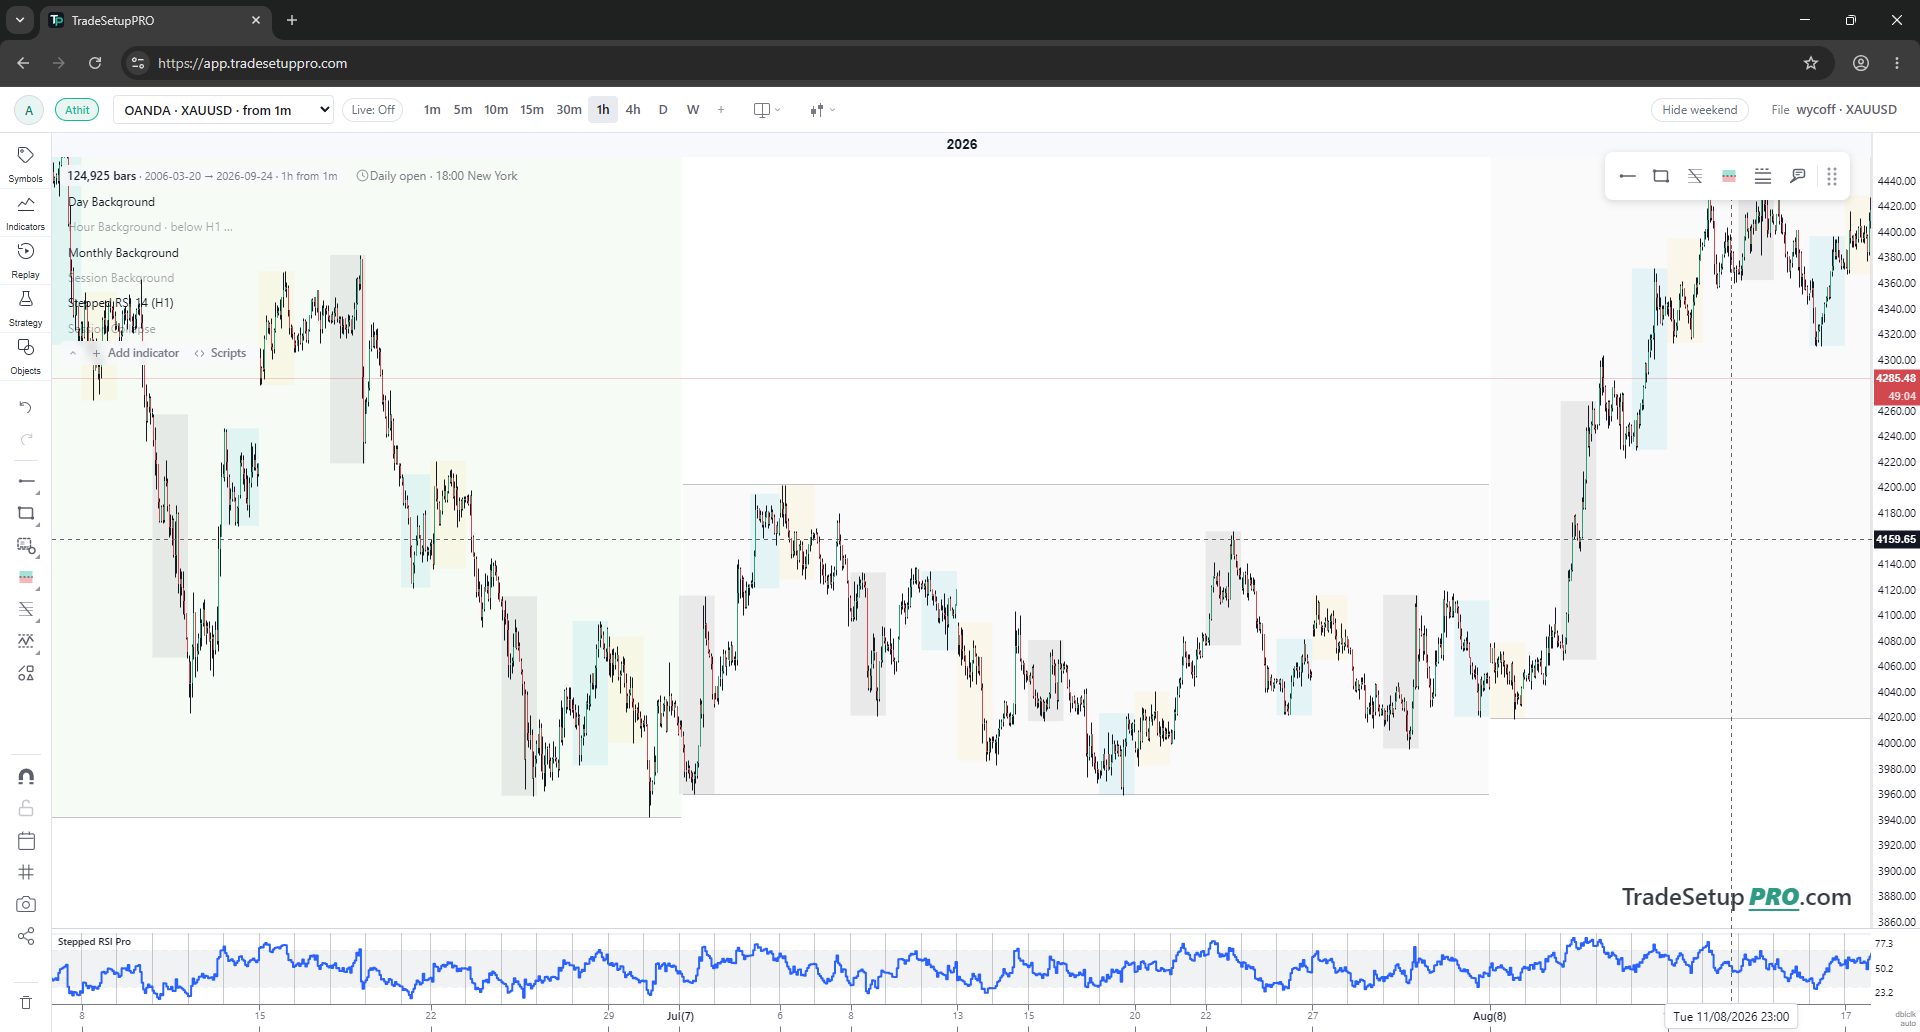
Wyckoff on a real XAUUSD chart: where was the entry?
A price-only Wyckoff read built from the actual OANDA XAUUSD hourly bars, with a support-test entry, invalidation and first objective measured from the file.
OANDA XAUUSD · H1
The support test before the range break
OANDA · H1
Price returned to test the lower range near 3,960. The 17 Jul 16:00 H1 candle closed at 3,997.380, used here as a test entry. The idea is invalid below 3,959.800; 4,202.660 is the first objective. Values are checked against the OANDA H1 OHLC file.
This chart has no actual traded volume, so it cannot confirm buying pressure or the effort-versus-result law.
READ FROM THE H1 FILE, NOT SCREENSHOT PIXELS
A planned entry before the breakout
Entry reference17 Jul 2026 · 16:00
Earlier: wait for 3,997.380 close. More cautious: wait for the next close at 4,001.375.
Invalidationต่ำกว่า 3,959.800
A break below the test low invalidates this support-hold idea. A live stop needs room for spread and costs.
First objective4,202.660
The range ceiling was reached on 5 Aug at 15:00 before that candle closed back below it.
The 16:00 entry has 205.280 points to the range ceiling versus 37.580 to the test low (5.46R); waiting for 17:00 gives 201.285 versus 41.575 (4.84R). Both use 3,959.800 before costs and any stop buffer. This is one historical outcome, not an expected return or proof of edge.
The cautious label is “a possible support test,” not a Spring: 3,959.800 did not undercut the prior decline low at 3,942.125. With no traded-volume confirmation that supply diminished, this is not a fully confirmed Wyckoff signal.
01
The range before the breakout
This reading uses the OANDA XAUUSD H1 file supplied with the app project, from 30 June to 6 August 2026. A sharp decline reached 3,942.125 on 30 June; price then rallied to 4,202.660 on 6 July and returned to the 3,960 area. For this example, 4,202.660 is the observed range ceiling and 3,942.125–3,960.320 is the lower support area. Those levels are measured from completed bars. “Accumulation” remains a hypothesis because price alone cannot establish who bought or why.
02
An early entry from the support test
On 17 July, the 15:00 H1 bar fell to 3,964.155 and closed at 3,966.320. The next bar had a wide range: it made a 3,959.800 low, then closed at 3,997.380. A faster rule uses that completed close as the long reference, before the range breakout; a more cautious rule waits for the 17:00 close at 4,001.375 for follow-through. These are price-based rules to replay, not fully confirmed Wyckoff signals: traded volume is absent and the test bar did not narrow clearly. Neither is a Spring, since the low did not undercut the earlier 3,942.125 campaign low.
03
Invalidation and first objective
The support-test idea is wrong if price breaks below 3,959.800 after the entry; a practical stop needs a pre-set buffer for spread and execution costs, so 3,959.800 is the invalidation reference, not a guaranteed fill. The first objective is the opposing range edge at 4,202.660. Price first touched it on 5 August at 15:00 (high 4,213.540), while that candle closed back below at 4,184.025. A limit exit at the boundary would have been reachable before the 16:00 close at 4,206.180 confirmed a breakout. From the 3,997.380 reference entry to the range edge is 205.280 points; to the test low is 37.580 points, about 5.46R before costs and any stop buffer.
04
What this example says about Wyckoff
Here the useful part is not a label on the later breakout: the range gives a place to watch, the return to support gives an earlier candidate entry, and the test low gives a price that cancels the idea. That made the method actionable before the move to the range ceiling. The trade worked in this one historical sample; one winner cannot show that the reading has an edge. To test that, apply the same definitions to every qualifying range, including failed tests, and compare with a simple support-bounce rule under the same costs.
05
What the file can and cannot confirm
The H1 file contains OHLC and tick volume, but its VOL column is zero. This article uses only price; it does not treat tick volume as total traded gold or claim effort-versus-result confirmation. The bars can show a sharp decline, a rebound, repeated support tests and a later break. They cannot prove accumulation, identify a Composite Man or guarantee another range will behave the same way.
Field checklist
The 30 Jun campaign low is 3,942.125; the 6 Jul range high is 4,202.660.
The 17 Jul 16:00 H1 close at 3,997.380 is the entry reference after the 3,959.800 test.
Invalidation is below the test low; add a stop buffer and costs before sizing.
The first objective is 4,202.660; it was touched on 5 Aug 15:00 before the later close above.
Repeat the same test rule on failed examples and compare it with a basic support-bounce rule.
Practice
Replay the file from 30 Jun without revealing future bars. Mark the 3,942.125 low, wait for the later support test, and record the 17 Jul 16:00 close as the entry reference only if your rule permits it. Set the invalidation and first objective before advancing. Then repeat the identical process on every comparable range, including failures.
Figures in this case study come from the named OANDA H1 file. One historical occurrence shows what the rule did here; it does not guarantee the next outcome.
Risk note
This article is educational and is not investment advice or an invitation to trade. Past outcomes do not guarantee future results.